
Graph Magic - Data Visualization Toolkit for Unity
Description
Supports: Win/Mac/Linux/Android/iOS/WebGL
Demo Scenes Descriptions:
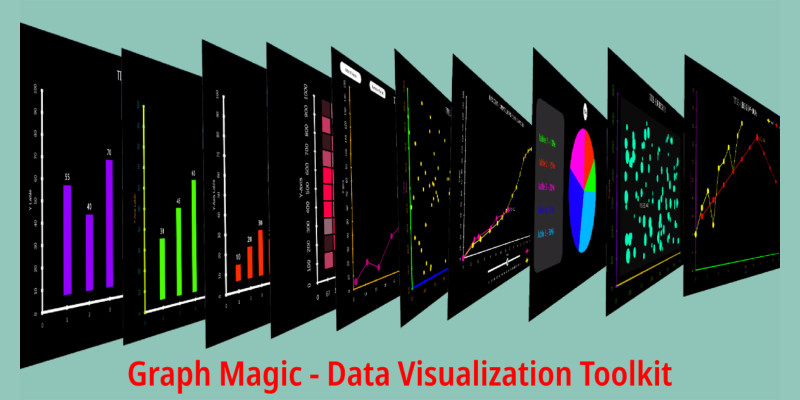
Bar Chart: Display data using vertical bars, making it easy to compare values across different categories. The bar chart demo showcases various customization options, such as bar colors and labels, allowing you to adapt the chart's appearance to your project's needs.
Bar Chart Real Time: Illustrates how to create a real-time updating bar chart. See how the chart dynamically changes as data values are modified, providing a dynamic and interactive visualization experience.
Bar Graph Dual: This demo showcases a dual-axis bar graph, enabling you to compare two different datasets with distinct scales on a single chart. Perfect for visualizing related but diverse data.
Bubble Chart: Display data points as bubbles, with their size representing one data dimension and their position representing another. The bubble chart demo demonstrates how to create engaging and informative bubble visualizations.
Funnel Chart: Present data as a funnel-shaped diagram, showcasing the progressive reduction of values in different stages. The funnel chart demo illustrates the creation of compelling funnel visualizations.
Heatmap Chart: Visualize data using a heatmap, where colors represent values across a 2D grid. The heatmap chart demo exhibits various heatmap customization possibilities.
Line Graph Dual: Display two different datasets with separate scales on a dual-axis line graph. This demo provides insights into creating visually appealing and informative dual-axis line charts.
Line Graph With Buttons: Showcases how interactive buttons can be used to manipulate and switch between different datasets or time periods on a line graph.
Line Graph With Slider: Utilizes sliders to allow users to control and explore data trends over time on a line graph.
Line Graph With Slider - Compare Trend: Demonstrates how to compare and contrast multiple data trends using sliders on a line graph.
Pie Chart: Present data as a circular chart divided into slices, with each slice representing a different category. The pie chart demo explores various customization options, including label placement and slice colors.
Pie Chart Real Time: Real-time updating pie chart demo, showcasing the dynamic changes in the chart as data values evolve.
Real Time Graph: An example of a real-time updating line graph that dynamically displays incoming data points in real-time.
Scatter Plot: Visualize data points as individual dots on a 2D plane. The scatter plot demo illustrates how to create captivating scatter visualizations.
With Graph Magic - Data Visualization, you have a comprehensive and versatile toolkit to create captivating and informative data visualizations in your Unity projects, enhancing user experience and fostering deeper data-driven insights.
Interactive Demo Scene: To showcase the clickable events feature, we have added an interactive demo scene:
Interactive Data Exploration: This demo scene demonstrates how to set up clickable events for data points in a scatter plot. When users click on individual data points, it triggers an animation that zooms in on the selected point and displays additional details about the corresponding data. Users can navigate through different data points, gaining valuable insights into the underlying data.
Note: The clickable events feature is not limited to the scatter plot demo; it can be applied to all supported chart types, giving you the flexibility to create interactive data visualizations tailored to your project's needs.
With the new clickable events feature, Graph Magic - Data Visualization takes interactivity and engagement to the next level, making your visualizations more immersive and empowering users to interact directly with the data. Whether you're creating educational apps, analytical tools, or data-driven games, this feature opens up exciting possibilities for data exploration and interaction.
Any issue please contact me at projekt.sumperk@gmail.com
Features
Key features of Graph Magic:
Versatile Chart Types: Graph Magic supports a wide range of chart types, including bar charts, line graphs, pie charts, scatter plots, funnels, heatmaps, and more. This diversity allows you to choose the most suitable chart for visualizing your specific data.
Real-Time Visualization: For applications requiring real-time data updates, Graph Magic provides real-time charting options. You can easily visualize dynamic data, making it perfect for monitoring and displaying changing values during gameplay or simulations.
Interactive Components: Enhance user engagement with interactive elements like buttons and sliders in your charts. Allow users to control and manipulate data representation, enabling them to gain deeper insights into the underlying data.
Customization Options: Graph Magic offers a wealth of customization options, allowing you to tailor the appearance of your charts to match your project's aesthetics. Adjust colors, styles, labels, and more, ensuring your visualizations seamlessly integrate into your Unity project.
Performance-Optimized: The asset is designed to ensure optimal performance even with large datasets. It utilizes efficient algorithms and rendering techniques to maintain smooth frame rates while displaying complex visualizations.
Mobile and VR Support: Graph Magic is compatible with mobile platforms and VR devices, enabling you to create data visualizations for a broad audience.
Additional Feature: Clickable Events for Each Data Point
Graph Magic now includes a powerful feature that allows you to add interactive click events to each data point in your visualizations. With this feature, you can enhance user engagement by enabling them to interact directly with the data, leading to a more immersive and informative experience.
Requirements
Unity Hub
Unity 2021.3.1f1
Instructions
Follow the documentation inside the project
| Author | cykodev |
|---|---|
| Category | App Templates / Unity / Assets |
| Price | $25 |
| Extended License | $75 |
| First Release | Jul 31, 2023 |
| Last Update | Jul 31, 2023 |
| Files included | Layered .png, .csproj, .unityproj, .prefab |
| Operating systems | iOS 10.0, Android 7.0, Android 8.0, iOS 11.0, Android 9.0, iOS 12.0, macOS 10.14, Windows 7, Windows 8, Windows 10, Unity 2019, Android 10.0, iOS 14.0, iOS 13.0, iOS 15.0, Android 11.0, Android 12.0, iOS 8.0, iOS 9.0, Android 4.0, Android 5.0, Android 6.0 |
Categories
Tags
External listing. code.market does not sell this product and does not process payment for it. Pricing, payment, delivery, licensing, refunds, and support are handled by the third-party merchant on its own website. We may earn an affiliate commission from a referral. Details.
Products of the Week.
Submit🥇

STOP GUESSING WHAT TO POST
AI that learns your brand voice and builds a month of consistent, on-brand social content: carousels, posts and hooks that sound like you, not like everyone else's AI.
SaaS · 6,507 views · 59 clicksSaaS · Week 46 · 6,507 views · 59 clicks
🥈

Conversational Backlinks for Busy Founders
Place Backlink Relevant Conversation for your domain across Forums and Conversations
Website · 45,388 views · 229 clicksWebsite · Week 46 · 45,388 views · 229 clicks
🥉

upvote.club
Free Social Media Engagement that Helps Boost Your Content. Upvote Club supports 19 social networks with 100+ engagement actions in one dashboard. Add links to your posts and get free engagement from real users.
SaaS · 43,380 views · 124 clicksSaaS · Week 46 · 43,380 views · 124 clicks
#4

Substack Posting API
Onboard your Agent to Substack. Write Publish on Substack via API
SaaS · 62,312 views · 204 clicksSaaS · Week 46 · 62,312 views · 204 clicks
#5
Seenshot App
Free, Fast, MacOS Screenshot app. Make Screenshot cmd+shift+2 and send it via link
Desktop App · 31,572 views · 125 clicksDesktop App · Week 46 · 31,572 views · 125 clicks
#6

Hand-Placed Backlinks $9.99 per link. Flat rate.
Buy hand-placed forum, Q-A and directory backlinks. Flat $9.99 per link, no subscriptions — you only pay for approved listings.
Website · 7,282 views · 19 clicksWebsite · Week 46 · 7,282 views · 19 clicks
#7
Free Invoice Generator - PDF Invoices in Your Browser, No Sign-Up
A free invoice maker for freelancers and small businesses: fill in the invoice, check the live preview, and download a PDF that looks exactly like it. Any currency, tax per item, three templates, no sign-up, and nothing leaves your device.
5,898 views · 20 clicksWeek 46 · 5,898 views · 20 clicks
#8

Merge PDF Files Free - Combine PDFs in Your Browser, No Upload
A free PDF merger for office workers, students, and freelancers: combine PDFs and images into one file in the browser, reorder files and pages, pick page ranges, keep bookmarks, and open password-protected PDFs. Nothing is uploaded, no sign-up, no watermark.
5,447 views · 16 clicksWeek 46 · 5,447 views · 16 clicks