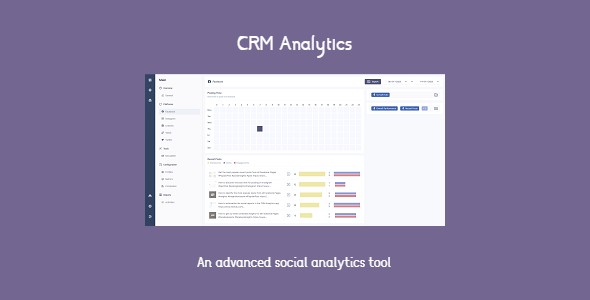
CRM Analytics - advanced social analytics tool with automated email reports
Description
CRM Analytics is an app for the Midrub CMS which is allowing to get advanced insights for Facebook, Instagram, Linkedin, Twitter and TikTok. Is a SAAS app and by plan is possible to control how the users will use it.
All insights could be exported in CSV and PDF files. Is possible to select a time interval for insights and export them in a CSV file or print.
This app could be used for automations purposes. It has the Newsletter feature where the users could schedule the reports for automatic sending by email with an attached PDF file.
The item price is low because the support is not included. The item is recommended only to the agencies/companies which have employers with the thorough knowledge of the item’s features which are described here. The documentation is public and if it is unclear for you, please don’t buy this item. The demo is available and if something is not as you expected, please don’t buy this item.
Demo Video:
Demo Website:
This app by default has support for 5 platforms:
Overall Performance – shows general insights about the Facebook Pages and their posts.
Recent Posts – shows the last 5 posts from the selected Facebook Pages. In each post is possible to see a preview and insights.
Popular Posts – shows the most popular 5 posts from the selected Facebook Pages(the app selects from each page 100 posts and selects the most popular to select more will be used too many server resources). In each post is possible to see a preview and insights.
Posting Time – shows the hours when is the best time for posting. The color intensity of the hours determines the hours popularity.
Pages Fans – shows the achieved and lost fans by days. Shows total growth and total number of fans.
Pages Impressions – shows the number of impressions achieved for pages.
Pages Engagements – shows the number of engagements achieved for pages.
Pages Views – shows the number of views achieved for pages.
Pages Video Views – shows the number of video views, grouped by days.
Posts Insights – shows the number of the posts impressions and engagements by days.
For Facebook you need the permission read_insights and pages_show_list.
Overall Performance – shows general insights about the Instagram accounts and their media.
Recent Media – shows the last 5 media from the selected Instagram accounts. In each media is possible to see a preview and insights.
Popular Media – shows the most popular 5 posts from the selected Instagram accounts(the app selects from each page 100 media and selects the most popular to select more will be used too many server resources). In each media is possible to see a preview and insights.
Posting Time – shows the hours when is the best time for posting. The color intensity of the hours determines the hours popularity.
Followers – shows total number of followers, followers achieved by days and total growth in percentage.
Impressions – shows total number of media impressions, impressions achieved by days and total growth in percentage.
Likes – shows total number of media likes, likes achieved by days and total growth in percentage.
Comments – shows total number of media comments, comments achieved by days and total growth in percentage.
Profile Visits – shows the number of visits for the selected Instagram Accounts. The visits and grouped by days and it shows even the total growth in percentage.
For Instagram you need to have approved the permission instagram_manage_insights and instagram_basic.
Overall Performance – shows general insights about the Linkedin Companies and their posts.
Recent Posts – shows the last 5 posts from the selected Linkedin Companies. In each post is possible to see a preview and insights.
Popular Posts – shows the most popular 5 posts from the selected Linkedin Companies(the app selects from each page 100 posts and selects the most popular to select more will be used too many server resources). In each post is possible to see a preview and insights.
Posting Time – shows the hours when is the best time for posting. The color intensity of the hours determines the hours popularity.
Followers – shows total number of followers for the selected Linkedin Companies. It shows even by days the achieved and lost followers(comparing with the previous day).
Company Views – shows by days the number of achieved views for the selected Linkedin Companies. Is possible to filter the views to be displayed only views from Mobile and only from Desktop.
For Linkedin you need to have the Marketing Developer Platform enabled.
TikTok
Overall Performance – shows general insights about the TikTok accounts and their videos.
Recent Videos – shows the last 5 videos from the selected TikTok accounts. In each video is possible to see a preview and insights.
Posting Time – shows the hours when is the best time for posting. The color intensity of the hours determines the hours popularity.
Followers – shows the number of followers, total growth in percentage for the selected time period and shows by days the number of achieved and lost followers.
Likes – shows the number of likes achieved for the published videos. It shows by day the number of the new likes and lost likes.
For TikTok you need to have the video.upload scope approved.
Overall Performance – shows general insights about the Twitter accounts and their tweets.
Recent Tweets – shows the last 5 tweets from the selected Twitter accounts. In each tweet is possible to see a preview and insights.
Popular Tweets – shows the most popular 5 tweets from the selected Twitter accounts(the app selects from each account 100 tweets and selects the most popular to select more will be used too many server resources). In each tweet is possible to see a preview and insights.
Posting Time – shows the hours when is the best time for posting. The color intensity of the hours determines the hours popularity.
Followers – shows the followers number for the selected Twitter accounts. By days it shows the achieved and lost followers.
Lists – shows the number of lists where the selected accounts are listed. By days it shows in how many lists were added the selected accounts and from how many lists were removed.
This app by default has 1 tool:
Newsletter
This tool is allowing to schedule reports to be sent by email. The users could schedule the reports to be sent in the wanted day of the week and at the wanted time. In each report is possible to select a time interval, company profile and enter multiple emails where will be sent the reports.
In the Newsletter tool is possible to select all available metrics and all available profiles. The tool has an email template with the support for all metrics and optionally by plan is possible to decide who will receive even an attached PDF with the metrics.
To generate PDF files i’m using the https://grabz.it/ service. The PDF files are optionally. The app has an email template with support for all insights.
In the Configuration the app has 3 pages:
Profiles
Is possible to connect the profiles which will be monitored automatically. The app monitors all profiles even if some of them were connected in another available apps.
Metrics
In the Metrics page is possible to reorder the metrics for all platforms and even for the Overview page. There the users could decide how will look their pages.
Companies
In this page is possible to create profiles for the PDFs files. Each profile has a header and a footer where is possible to add a logo, text and a date.
What is possible to control by plans?
In the demo for the free plans the insights are available for just a day. This happens because the app should save the insights in the database and every day it should check the connected accounts for insights. There are a lot of people which just coming for testing, they are connecting their social accounts and is a waste of the server resources to monitor their accounts and save the insights in the database forever.
It’s possible to control by plan the number of the reports which a user could create in the Newsletter page.
It’s possible to control by plan the number of the email addresses where will be sent a report.
It’s possible by plan to decide which users will have attached the PDF files to the sent emails.
Changelogs
0.0.7
- Was updated the Linkedin’s api.
0.0.6
- Fixed some bugs related to the newsletter.
- Was removed the Daily period in the newsletter tool.
0.0.5
- Improvements in the posting time metrics.
0.0.4
- Fixed a bug related to the month displaying in the Overview page.
- Fixed a bug in the posts displaying metrics.
- Some improvements for history displaying in the Newsletter page.
0.0.3
- Removed the times pickers for the plans where the reports are not saved in the database.
- Many Improvements.
0.0.2
- Many bugs fixes and improvements.
- The documentation was updated.
0.0.1
- First release.
Online Documentation:
About: https://www.midrub.com/categories/analytics-3
Installation/Configuration: https://www.midrub.com/categories/analytics-2
Usage: https://www.midrub.com/categories/analytics
Server Requirements:
PHP 8.0+, MySQL 8.0, CURL, HTTP/2.0, Imagick, GD Library
Categories
External listing. code.market does not sell this product and does not process payment for it. Pricing, payment, delivery, licensing, refunds, and support are handled by the third-party merchant on its own website. We may earn an affiliate commission from a referral. Details.
Products of the Week.
Submit#1

wanapi.app
Wan API is a developer platform for the Wan video model family. Compare Wan 3.0, Prime and Pro specifications and prices, then prepare a request in the preview playground.
Other · 7,663 views · 19 clicksOther · Week 42 · 7,663 views · 19 clicks
#2

wanapi.ai
Wan API is a developer platform for the Wan video model family. Compare Wan 3.0, Prime and Pro specifications and prices, then prepare a request in the preview playground.
Other · 7,064 views · 11 clicksOther · Week 42 · 7,064 views · 11 clicks
#3

yee.site
Your link in bio, but a real website. Start from beautiful templates and ready-made sections, then add a shop, bookings, a blog and as many pages as you need. Perfect for your link in bio, portfolio or personal site.
Other · 13,101 views · 20 clicksOther · Week 42 · 13,101 views · 20 clicks
#4

upvote.club
Free Social Media Engagement that Helps Boost Your Content. Upvote Club supports 19 social networks with 100+ engagement actions in one dashboard. Add links to your posts and get free engagement from real users.
SaaS · 34,007 views · 104 clicksSaaS · Week 42 · 34,007 views · 104 clicks
#5

Seenshot App
Free, Fast, MacOS Screenshot app. Make Screenshot cmd+shift+2 and send it via link
Desktop App · 22,504 views · 114 clicksDesktop App · Week 42 · 22,504 views · 114 clicks
#6

Conversational Backlinks for Busy Founders
Place Backlink Relevant Conversation for your domain across Forums and Conversations
Website · 34,291 views · 204 clicksWebsite · Week 42 · 34,291 views · 204 clicks
#7

Substack Posting API
Onboard your Agent to Substack. Write Publish on Substack via API
SaaS · 53,173 views · 190 clicksSaaS · Week 42 · 53,173 views · 190 clicks
#8

codester.com
SocialDesk+: Omnichannel Social Commerce & Business Management Platform This is stronger than simply “Social Commerce and Messaging” because it tells buyers this is a complete business platform, not just a messaging script. Turn Social Conversations Into Sales SocialDesk+ is a complete omnichannel social commerce and business management platform built for businesses that sell and communicate with customers through social media. Instead of switching between WhatsApp, Facebook, Instagram and TikTok, businesses can manage customer conversations, comments, products, leads, follow-ups, automation, teams and business reports from one professional workspace. And because the full source code is included, developers, agencies and entrepreneurs can customize, rebrand and launch SocialDesk+ as their own business solution or SaaS platform. 🚀 Build Your Own Social Commerce Business SocialDesk+ gives you the foundation to launch: - Your own SaaS platform - A white-label social CRM - A social-commerce management system - A customer communication platform - A business messaging solution - A custom solution for clients - A multi-business subscription platform 💬 Connect Your Customers Supported social channels include: WhatsApp • Facebook • Instagram • TikTok Bring supported conversations into one centralized workspace and help businesses respond faster without constantly switching between platforms. 🛍️ More Than a Messaging Platform SocialDesk+ combines communication with the tools businesses need to manage customer opportunities: Inbox Manage customer conversations from connected channels. Comments Monitor and respond to social-media comments. Customers & Leads Organize customer information and potential buyers. Products & Catalog Manage products and give your team quick access to product information. Follow-Ups Make sure potential customers don't get forgotten. Automation Automate repetitive customer questions and responses. AI Assistant Provide AI-assisted communication when configured. Team Management Give managers and staff access to the business workspace. Reports & Analytics Track activity using business reports and analytics. The current product listing already includes these capabilities. 🔥 Why Buyers Will Want It Launch Faster Start with an already-built business platform instead of developing the entire system from zero. Customize Everything The full source code is included, allowing developers to change branding, features, workflows and integrations. Build a SaaS Create multiple business workspaces and offer SocialDesk+ as a subscription-based service. Sell to Businesses Offer it to retailers, restaurants, service businesses, online sellers, agencies and other businesses that communicate with customers through social media. Mobile + Web + Backend This isn't just a mobile UI template. It includes: - Flutter mobile application - Python / FastAPI backend - Web interface - Administration tools - Database infrastructure - API-based architecture - SQLite / PostgreSQL support - Android and iOS project structure 💼 One Platform. Multiple Business Opportunities. For SaaS Entrepreneurs Launch your own subscription platform and allow multiple businesses to operate inside separate workspaces. For Software Agencies Customize and rebrand the platform for clients instead of building an omnichannel business system from scratch. For Developers Use the complete source code as a foundation for your own social-commerce or customer-management product. For Businesses Deploy a dedicated version for your own customer-service and social-commerce operations. 🧩 What's Included Mobile - Flutter / Dart - Android - iOS project Backend - Python - FastAPI - SQLAlchemy - Alembic Database - SQLite - PostgreSQL Web - HTML5 - CSS3 - JavaScript Deployment - Docker - Docker Compose - Production configuration Business Platform - Multi-workspace architecture - Authentication - Teams - Customers - Products - Messaging - Comments - Automation - Reports - Subscriptions - Administration The current listing also documents third-party integrations such as Meta, TikTok, Stripe, Firebase, SMTP and optional OpenAI configuration. ⚡ What Makes SocialDesk+ Different? You're not buying a simple: ❌ Chat UI ❌ WhatsApp clone ❌ Flutter template ❌ Admin dashboard ❌ Basic CRM You're getting a complete business platform foundation that can be customized, branded and commercialized. Connect. Automate. Manage. Grow. SocialDesk+ Omnichannel Social Commerce & Business Management Platform One important change I'd make to the current listing The current page starts with: “A simple guide to managing your social conversations, customers, products and business activity.”
Other · 20,551 views · 35 clicksOther · Week 42 · 20,551 views · 35 clicks
#9

sandbook.app
Sandbook reads EPUB, PDF, web pages and scanned pages aloud with Kokoro TTS, an open neural voice model that runs on your iPhone, free and offline. Choose from 41 natural voices in English, Spanish, French, Italian, Brazilian Portuguese and Hindi and follow each word as it is spoken. Try the same voices in your browser first with the free Kokoro TTS online demo.
Other · 20,474 views · 17 clicksOther · Week 42 · 20,474 views · 17 clicks