Chartli - Interactive Chart
Description
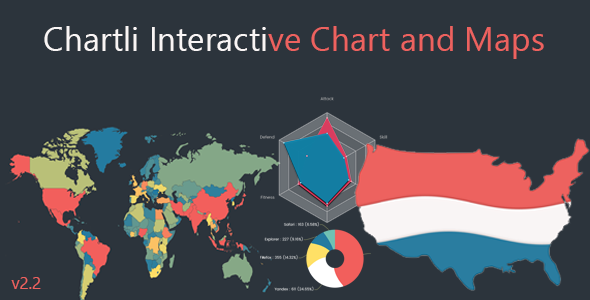
Chartli v2.2 – Jquery Interactive Charts And Maps Plugin
Create your own interactive line,bar,pie,radar,map,cone,chord e.t.c. chart easily
“Chartli” is a chart plugin developed on MIT Licenced Echarts
Chartli Wordpress Version Released
- Power Customizable
- Json data support (New)
- Greatly Examples
- Save as PNG Images all charts
- Change chart type easily
- Change color easily
- Customizable Map Charts
- Interactive Chart Elements
- Animating Charts
- Timeline
- Easily change data values
- Included documentation file
- From Baidu EFE team
    <script type="text/javascript">

                var lineChart= chartli.init(document.getElementById('lineID'));
                var option = {
                    ...
                }
                lineChart.setOption(option);

    </script>
- 6 month free support included from author
- Free lifetime product updates guarantee
- 360 degrees quality control
Secure payment & money back guarantee